
This section covers how to use the tone function to play sounds in the Desmos Graphing Calculator. With a bit of creativity, you can even compose music!
tone ( Frequency, Gain )
The function plays a sound at a frequency of . You can specify frequencies between and .
For example, try entering:
A button to play the sound will appear above the expression, as shown in the image below.
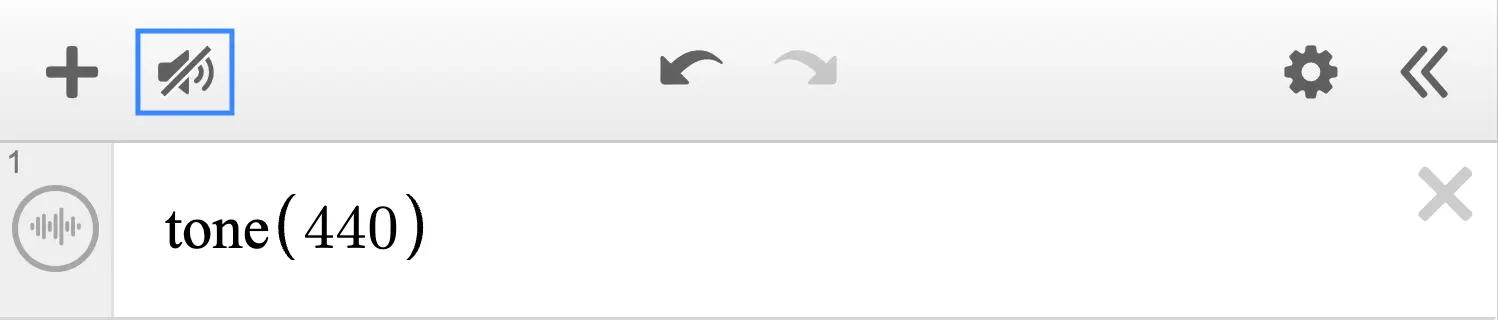
By default, the sound is muted. Press the button to unmute it, and you should hear a sine wave at .
You can also control the volume (gain) by adding a second argument:
The maximum gain depends on the frequency. Specifically, the maximum value is calculated using the formula . This means higher frequencies have a lower maximum gain.
Various Examples
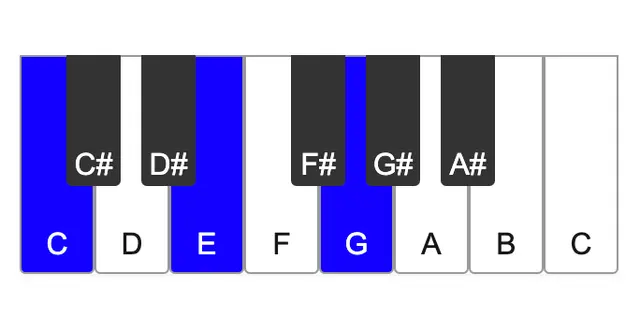
Simple Melody
Click the PLAY / STOP button below the graph to play the melody.
The melody is created by changing the frequency. For more details on how to calculate the frequencies, check out this article on musical scales.
Beats
Here's an example of beats:
For more details, see this article:
