
I created a simple obstacle avoidance game using Desmos! Let me show you how you can make a game like this.
Completed Game
Press the START/STOP button to start the game. Avoid all the purple obstacles to win!
Basic Mechanism
For details, it’s quicker to check the linked graph, but I’ll explain the basic mechanism here.
Updating the Graph with a Ticker
In Desmos, you can use a ticker to update variable values at regular intervals. For more details, check out this article.
When creating a game, the main idea is to use the ticker to update the graph. Specifically, it updates the player’s coordinates and checks for collisions at regular intervals.
Player
The player’s coordinates and vertical velocity are managed using variables . The variable represents the size (radius).
The player is drawn as a circle to make collision detection easier later.
You can access the coordinate of using .
Obstacles
Obstacles are created as a list and are also drawn as circles.
This creates obstacles moving left at a speed of . To add variety, the positions and radii of the obstacles are randomized.
Using random(a,b), you can generate a list of random numbers. The parameter is the seed value for random number generation, so changing produces different random numbers.
Updating Coordinates
The ticker executes the following actions to update coordinates:
The argument is a special variable available in the ticker, which represents the elapsed time since the last execution. For more details, refer to the article mentioned earlier.
Here’s what each action does:
First, updates the time by adding the elapsed time.
updates the player’s coordinate. Normally, it adds velocity ✕ elapsed time to the coordinate. However, if the player is about to go below the ground, it adjusts the coordinate to keep the player on the ground. represents the coordinate of the ground plus the player’s radius, i.e., the coordinate when the player touches the ground.
updates the player’s vertical velocity. Normally, it subtracts gravity acceleration ✕ elapsed time, but if the player is on the ground, it sets the velocity to .
Control with Buttons
Pressing a button makes the player jump. This is done by executing an action when clicking on the graph.
The action slightly adjusts the player’s position upward to ensure it’s considered off the ground.
Collision and Clear Detection
Detecting collisions with obstacles is crucial. This is done by calculating the distance to obstacles.
Although it looks complex, the logic is simple. The numerator represents the squared distance between the centers of the obstacle and the player. The denominator is the squared sum of their radii. If this fraction is less than , it means the distance between their centers is less than the sum of their radii, indicating a collision.
Since there are multiple obstacles, this fraction is a list. If the minimum value of this list is less than , it means at least one obstacle has collided with the player.
This collision detection is executed by the ticker, checking for collisions during each update.
Clear detection works in a similar way.
is the last element of , i.e., the initial coordinate of the last obstacle. represents the coordinate slightly to the right of the last obstacle. If this becomes less than or equal to , the game is cleared. Of course, it also checks that the game is not in a game-over state.
Retry Button
Pressing the retry button resets various variables.
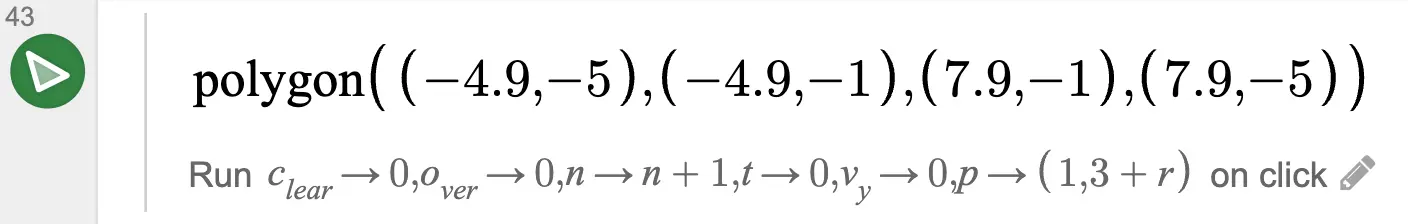
Notably, is used. is the seed value for generating random obstacles. Changing this value during a retry alters the size and position of the obstacles.
Tips
Responsive Graphs
A common challenge when creating Desmos graphs is that they may break when viewed on devices with different screen sizes or when zoomed in or out.
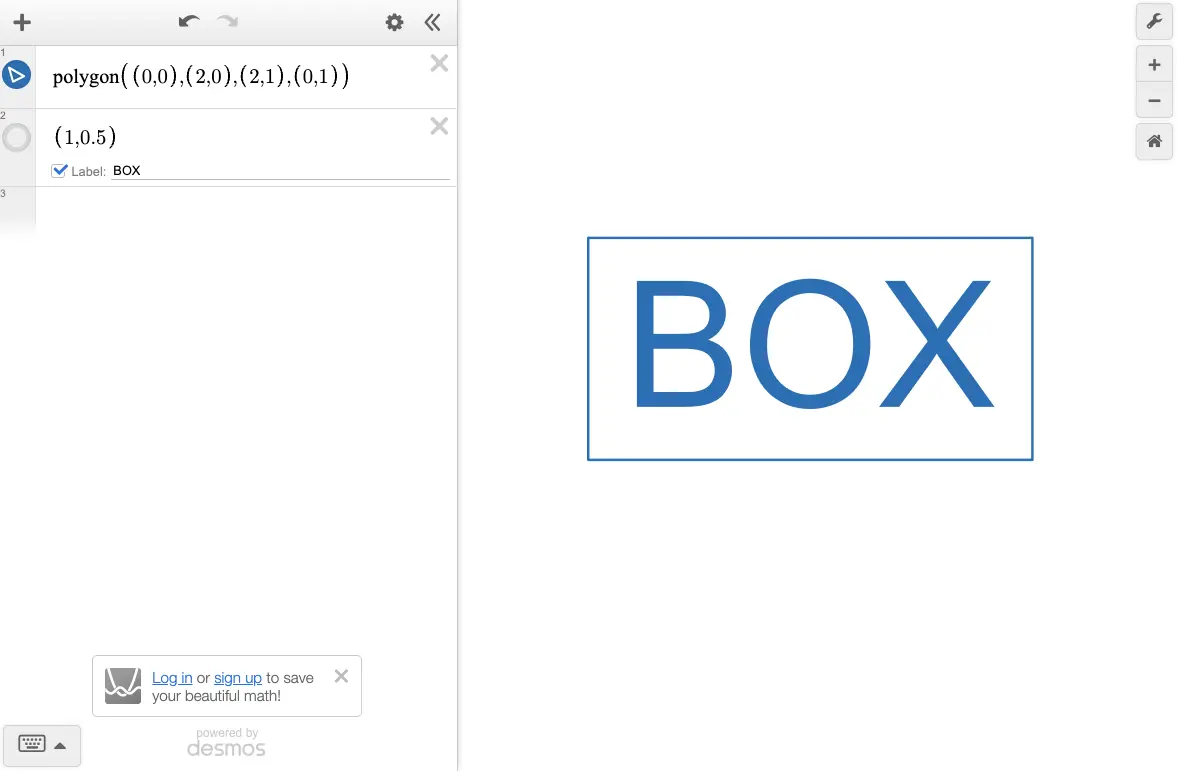
For example, creating a graph on a large tablet screen might look like this:
However, opening the same graph on a smartphone might look like this:
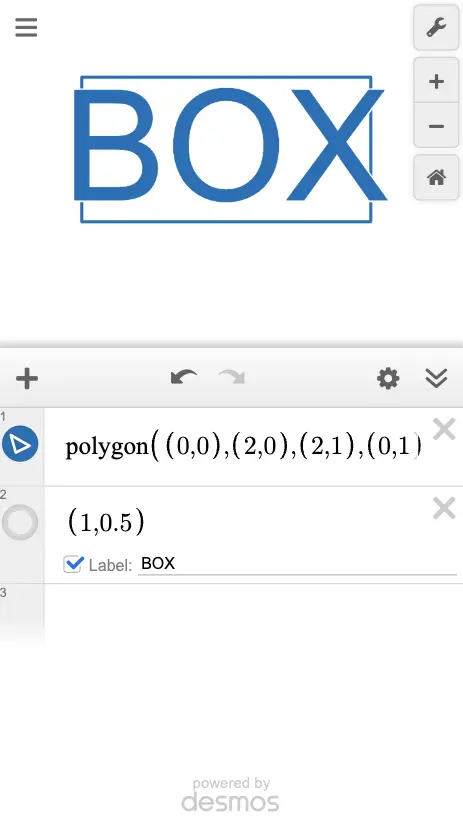
The "BOX" label appears larger, breaking the layout.
This happens because the label size is adjusted to remain readable based on the screen size.
To prevent such layout issues and create responsive graphs, there are two key points:
Key Points for Responsive Graphs
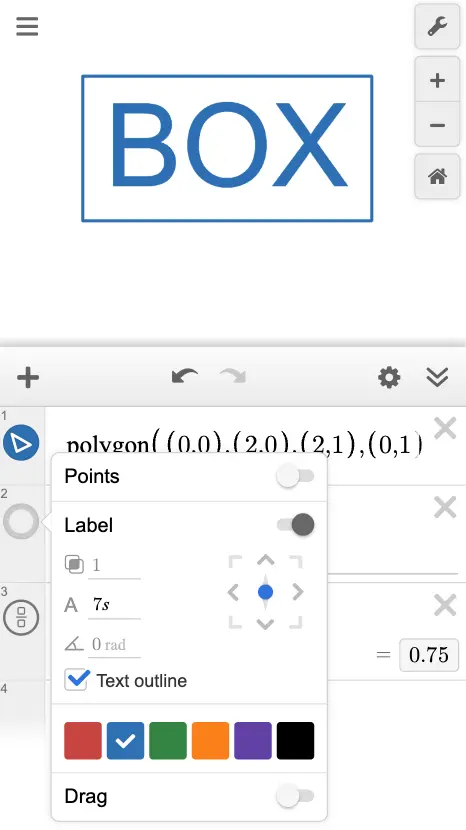
- Specify label (point) sizes using
- Fix the graph's display range
Desmos provides a special variable representing the screen size. By using this to specify label sizes, the relative size of labels remains consistent regardless of screen size.
For example:
Using this to specify label sizes ensures they fit neatly:
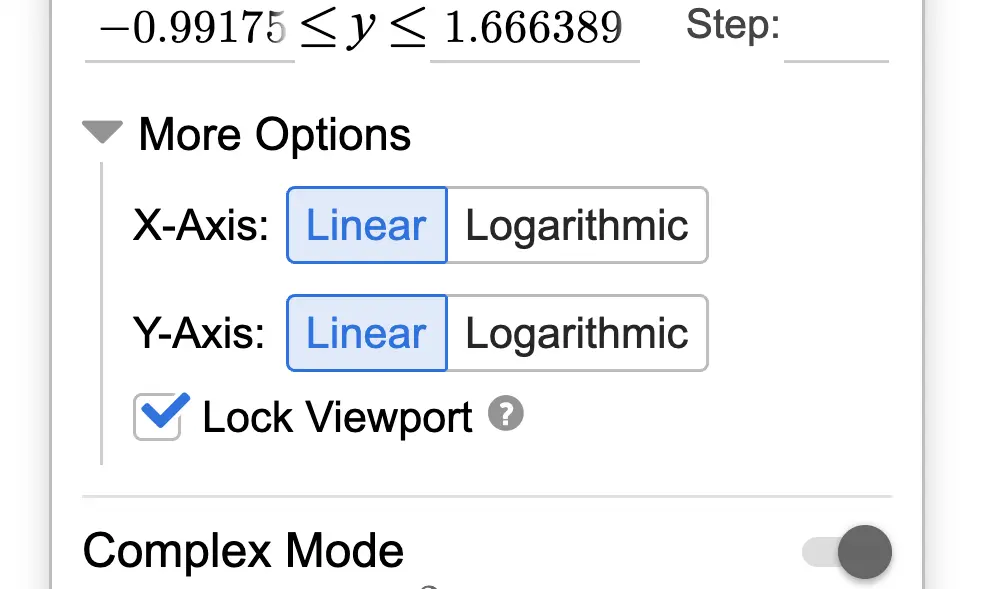
Fixing the display range is also important. Since label sizes remain unchanged when zooming in or out, fixing the display range prevents layout issues caused by zooming.
Optimizing Graph Performance
In this game, there are many obstacles, which can make the graph heavy. To optimize performance, only obstacles visible on the screen are drawn and checked for collisions.
Specifically:
This ensures that only obstacles potentially visible on the screen are drawn.