

Have you heard of the Doppler effect? It is a phenomenon where the observed frequency changes depending on the speed of the wave source or the observer. Let's explore the Doppler effect through an animation!
Animation
You can drag the three points above to change the speed of the points or the wind. Additionally, you can adjust the speed of the wave using the slider below the graph.
When the wave collides, the observer (green circle) flashes red. Observe how this red flashing changes when you vary the speed of the wave source!
Two Types of Frequencies
To understand the Doppler effect, let's first understand the difference between the frequency of the wave source and the frequency observed by the observer!
Frequency of the Wave Source
The frequency of the wave source represents how many waves the source generates per unit time. For example, if the source generates 3 waves per second, its frequency is .
Frequency Observed by the Observer
The frequency observed by the observer represents how many waves the observer detects per unit time. For example, if the observer detects 5 waves per second, the observed frequency is .
Observe the Doppler Effect Through Animation
Now, let's observe the Doppler effect by interacting with the animation!
When the Wave Source Approaches
Initially, the wave source is set to approach the observer.

Can you see that the waves on the right side of the wave source are more compressed compared to the left side? More precisely, the wavelength on the right side is shorter.
Due to the shorter wavelength, the observer receives more waves in a shorter time. In other words, the observed frequency increases.
When the Wave Source Moves Away
Now, set the wave source's speed to move leftward, away from the observer.
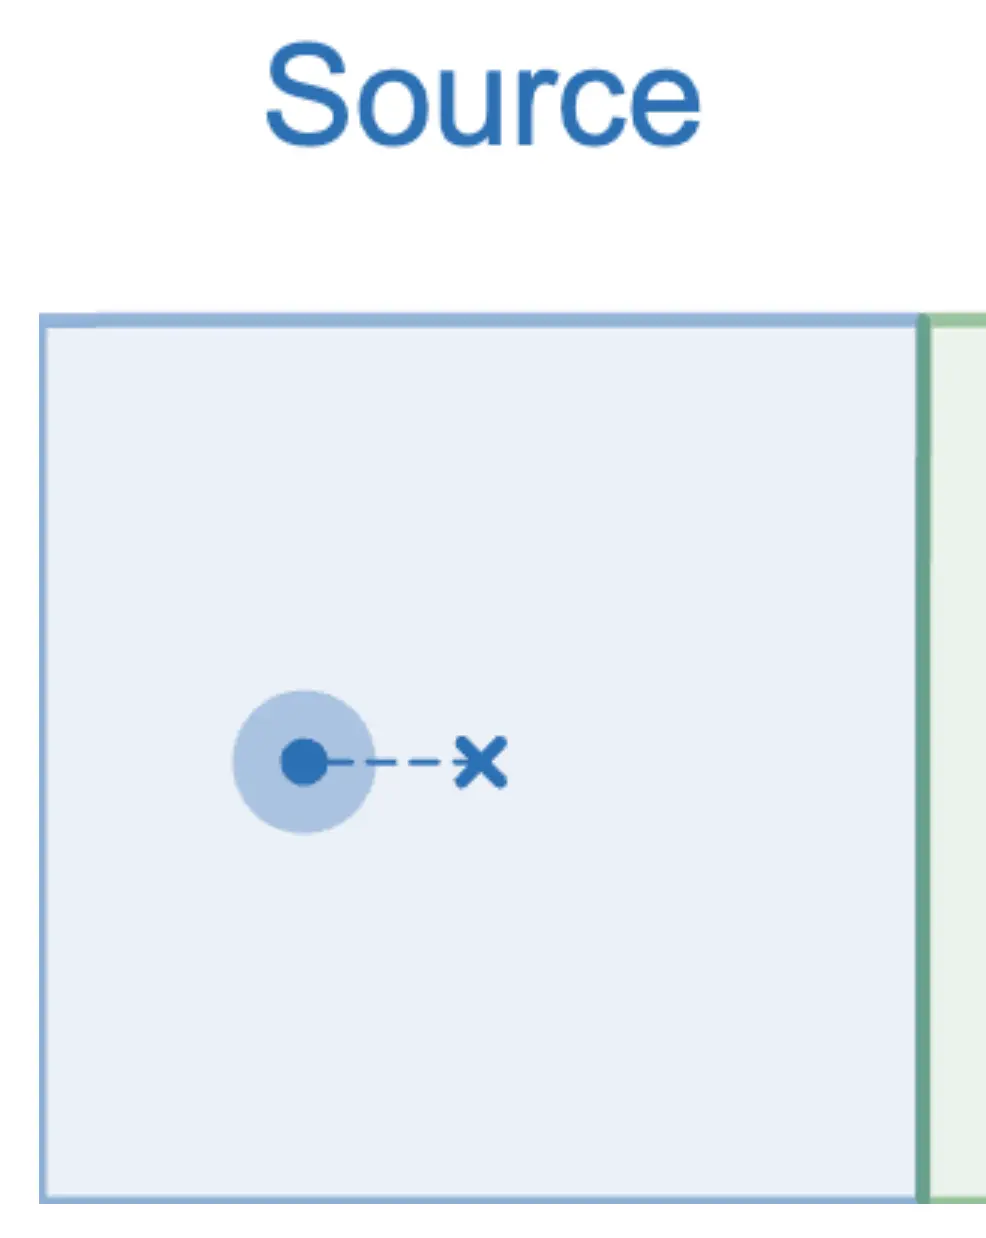
Drag the blue point representing the wave source's speed to the left, as shown in the image above.
You should see the following:

This time, the waves on the right side of the wave source are more spread out compared to the left side. In other words, the wavelength on the right side is longer, and the observed frequency decreases.
Calculating the Observed Frequency
Let's calculate the observed frequency in detail.
For simplicity, consider motion along the axis. Let the frequency of the wave source be , the speed of the wave be , the speed of the wave source be , and the speed of the observer be .
Assume that the direction from the wave source to the observer is positive.

First, let's determine the wavelength.
The wave source emits waves in . During this time, the wave source moves , as shown in the figure.

Note that the first wave emitted is ahead after .
Therefore, there are waves in the range , and the wavelength is:
Next, let's calculate the observed frequency based on this wavelength. Consider the number of waves received by the observer in .
From the observer's perspective, the wave approaches at a speed of , so the observer receives waves in the range .
The number of waves in this range is:
Therefore, the observed frequency is the number of waves received per unit time:
And that's how it's calculated!
Shock Waves
By carefully adjusting the speed of the wave and the wave source, you can create a phenomenon called a shock wave, which is a wave with a very large amplitude.

Details about shock waves will be introduced in another article.

