
Desmos Graphing Calculator provides several default colors for graphs and labels, and you can specify their colors.

Additionally, you can use custom-defined colors. Since this requires a few steps, let's go through them one by one.
Defining Colors
First, you need to define a new color and assign it to a variable. Here are some ways to define colors:
rgb (Red, Green, Blue)
rgb() specifies the proportion of red, green, and blue, each ranging from 0 to 255.

hsv (Hue, Saturation, Value)
hsv() specifies hue, saturation, and value. Hue ranges from 0 to 360, saturation from 0 to 1, and value from 0 to 1.

Using Defined Colors
Once you assign a defined color to a variable, you can use it.
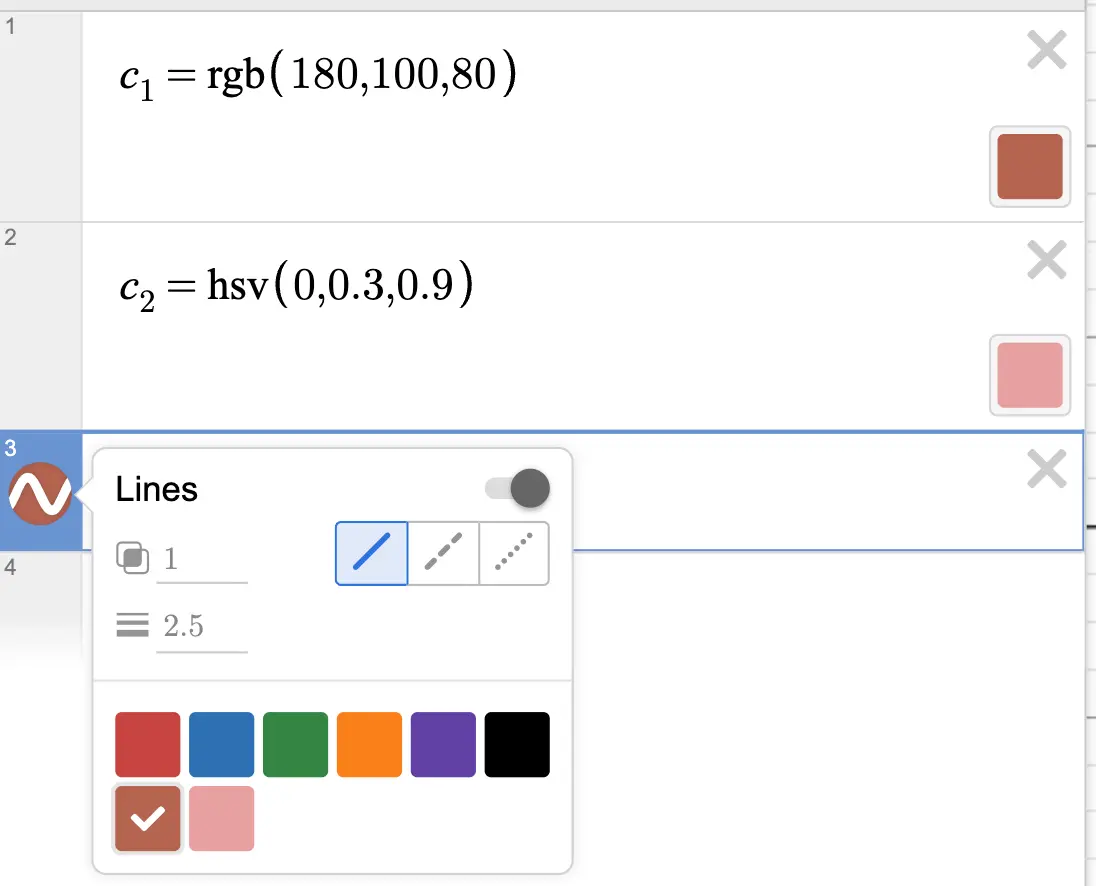
Note that you must assign the color to a variable; otherwise, it won't appear in the options.
Advanced
Variable-Dependent Colors
The rgb() and hsv() functions can take variables as arguments. This means you can create colors that change based on variable values. You can also use curly braces {} to define conditional expressions.
Defining Colors in Lists
You can use lists or for loops to define multiple colors at once.
For example, the graph below demonstrates how to plot multiple points, each with a different color:
You can even use this technique to create gradients.