Desmos Graphing Calculator is a web application that allows you to intuitively draw various graphs. (A smartphone app version is also available.)
First, let's try drawing various equations!
Types of Equations
You can draw equations such as explicit functions, implicit functions, inequalities, and points.
Additionally, you can use the parameter variable to create parametric representations.
You can also perform vector operations in this case. (Points and vectors are treated equivalently.)
Furthermore, by changing the variables to , they are treated as polar coordinates. (You can also change the grid lines to polar coordinate ones from the settings in the top right.)
In addition, various features such as lists, tables, and complex numbers are supported. Please refer to another article for details.
You can also toggle the display of equations by pressing the button to the left of the equation.

Adding Variables
Characters other than can be used as variables.
(Here, "variables" refer to something that stores a value, which is slightly different from the variables that appear in mathematics.)
It's simple to use: when you enter an undefined character in an equation, a "add slider" button will appear. By pressing this button, you can add a variable.

The added variable can be intuitively manipulated by moving the slider. Additionally, you can add a domain or major ticks, or continuously change the variable by pressing the button on the left.
Added variables can be referenced from any equation. If you want to use a temporary variable (i.e., a local scope variable) for a specific equation, you can solve this by using for or with.
For more details, please refer to this article.
Adding Notes
You can add Notes by selecting "note" from the add button in the top left.
When operating on a computer, you can switch from an equation to a note by first entering ".
Reordering and Managing with Folders
You can reorder equations and explanations by dragging the left side.
Additionally, by adding a folder from the add button in the top left, you can add a folder to manage equations and explanations collectively. You can drag equations under the folder to include them in the folder.
Alternatively, you can switch from an equation to a folder by first entering folder.
Saving and Sharing Graphs
You can save the graphs you create and share them with others.
To save a graph, first create an account. You can quickly create an account by linking it with a Google account, etc.
Once you have created an account, you can create or load graphs from the menu on the left.
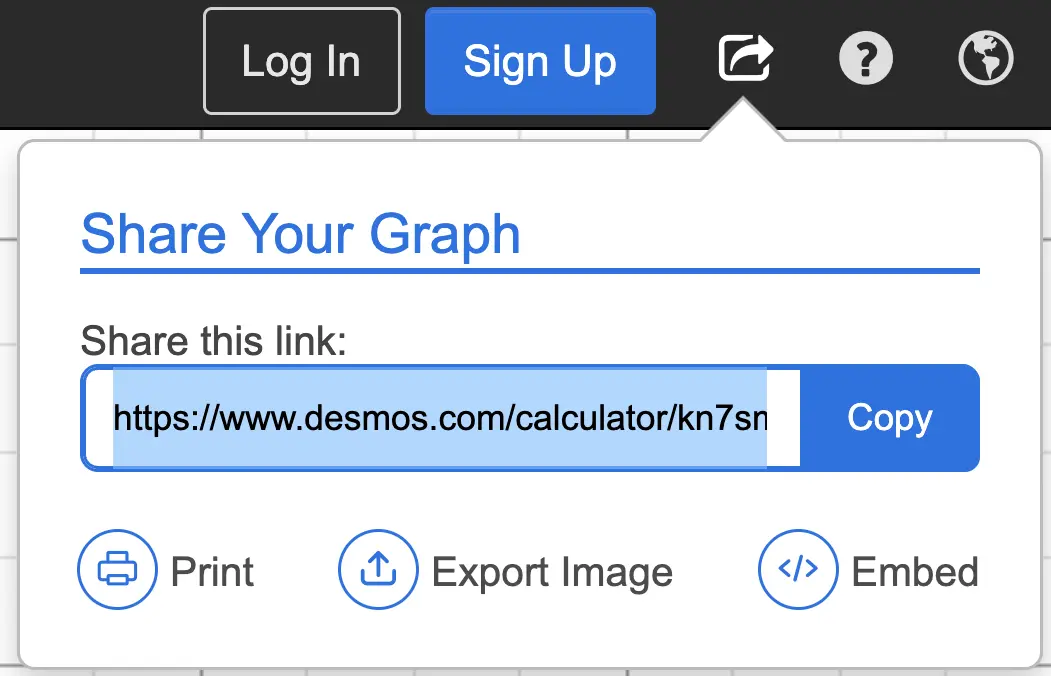
To share a graph, open the graph on a device with a large screen, such as a computer or tablet. Press the share button in the top right to generate a URL for sharing. Anyone can open the same graph by accessing this URL.
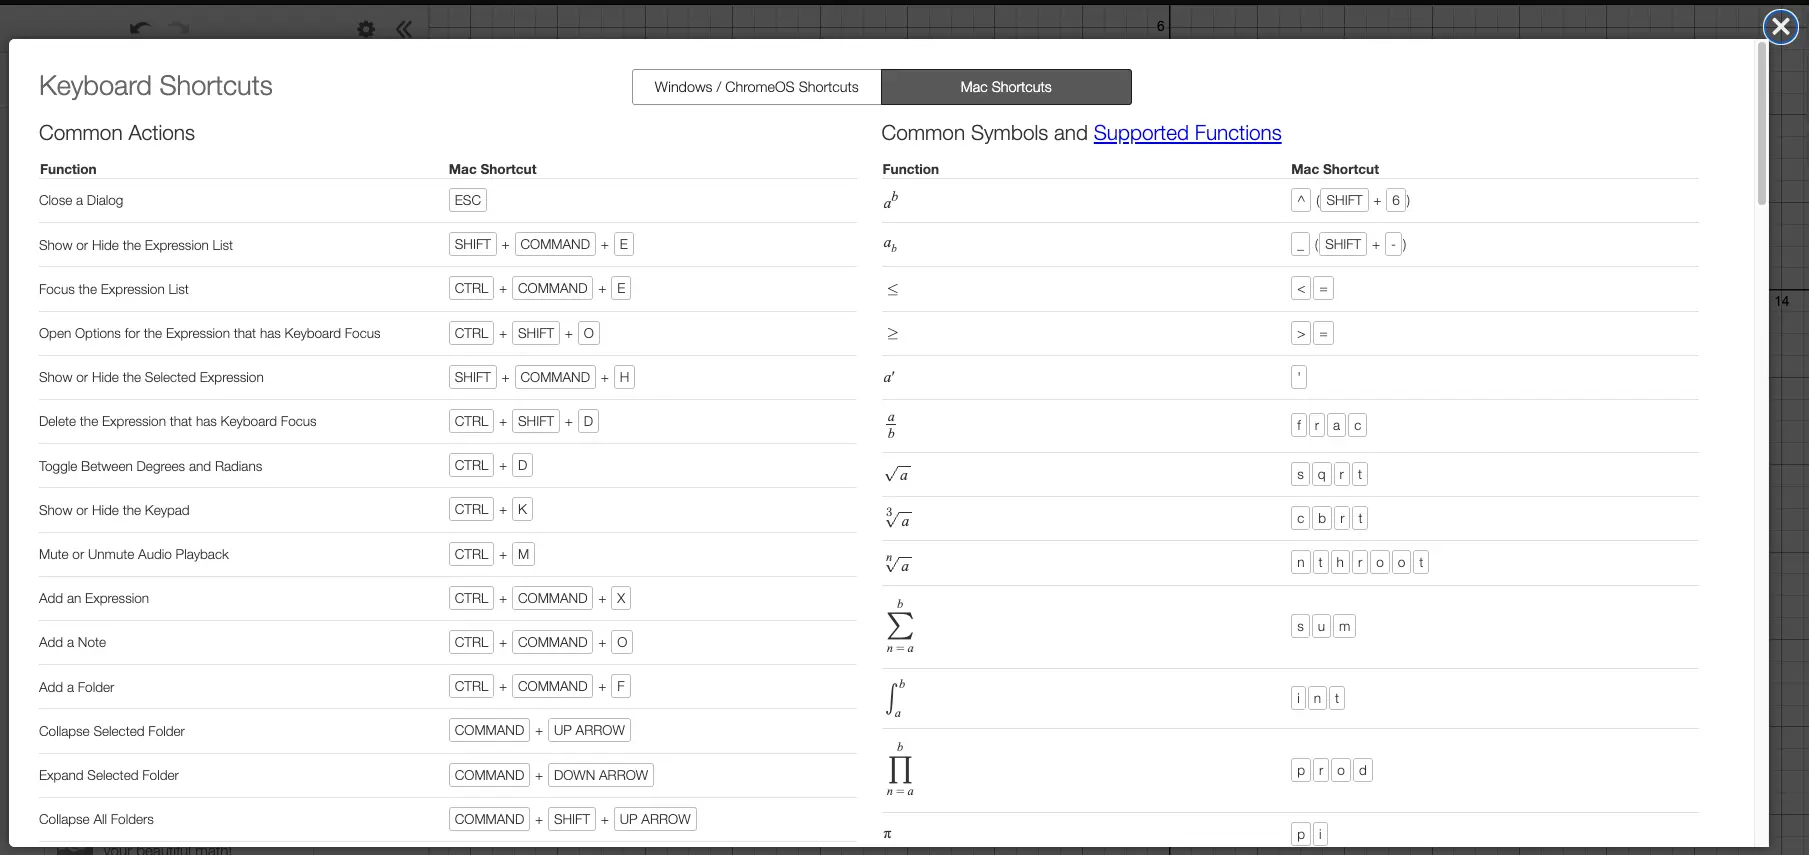
Others
On Mac, press command+/, and on Windows, press Ctrl+/ to open the list of keyboard shortcuts.