
This section explains how to use actions and tickers in the Desmos Graphing Calculator. These are powerful tools that can significantly enhance what you can do with Desmos.
Actions
Basics of Actions
Actions are flexible tools that let you manipulate variable values dynamically.
Define as you like, then input a->a+1.
The -> automatically converts to a right arrow and is recognized as an action.
Click the arrow button to the left of the equation. The action will execute, and the value of will increase by 1 each time.
In other words, is being updated to .
Multiple Actions
You can execute multiple actions at the same time.
In this case, is assigned the value of before the action is executed. So, after one execution, will result.
When multiple actions are listed together, they execute simultaneously. This means you cannot assign multiple values to the same variable in one operation.
For example:
will result in an error stating, "An action cannot specify multiple update rules for 'a'."
Assigning Actions to Variables
Actions themselves can be assigned to variables.
As shown above, executing will execute simultaneously. Similarly,
will result in an error because specifies multiple update rules for .
Executing Actions by Clicking on Graphs
Points, functions, and other graph elements can execute actions when clicked.
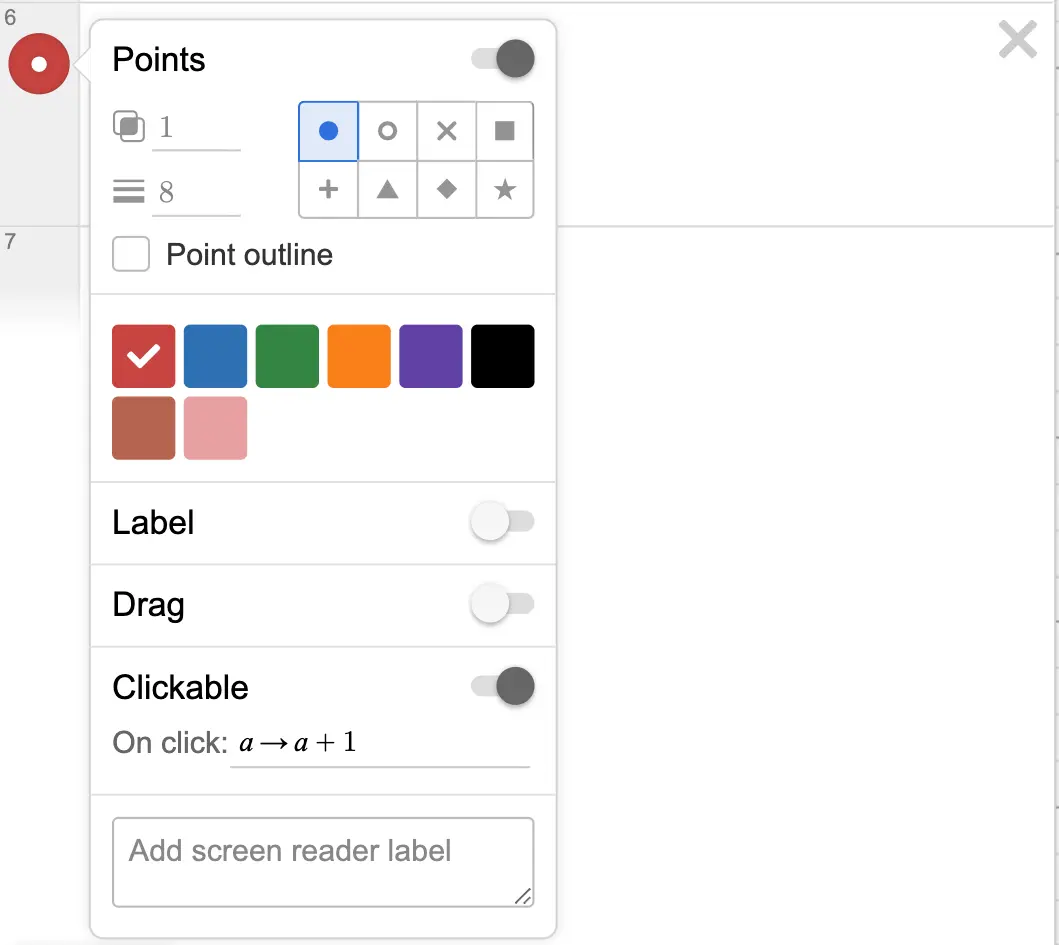
As shown in the image above, you can make a graph clickable by enabling the option in the equation settings and specifying the action to execute on click.
This lets you manipulate variables by clicking on graphs or labels.
Click the label +1 / -1. You should see the value of change.
If you assign an action to a variable, you can also specify that variable.
Tickers
Tickers let you execute specified actions at regular intervals.
To add a ticker, select it from the "+" menu.
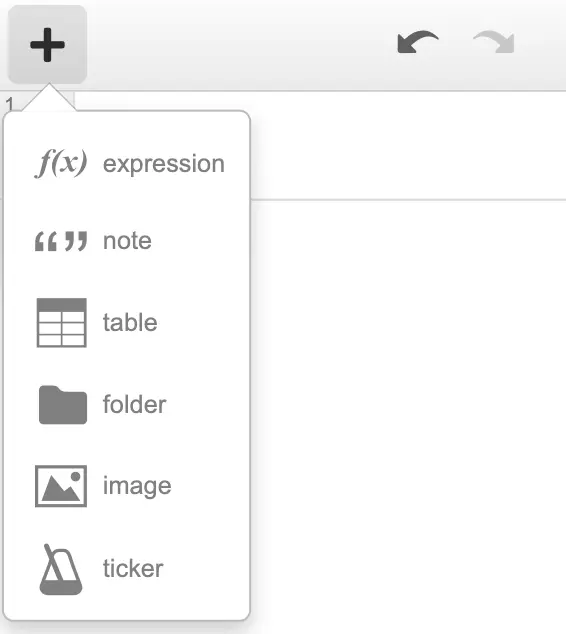
If the ticker option is not visible, try adding an action first. The ticker option should then appear.
Once the ticker is added, specify an action in the "Run" section and set an appropriate value in the right-hand field.
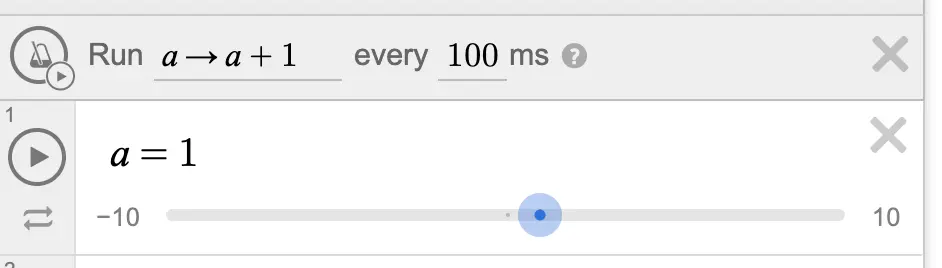
Clicking the metronome icon will start the ticker. As shown in the image above, will execute every 100 milliseconds.
Advanced
Getting Ticker Execution Time
Tickers generally execute at the specified intervals, but if the calculations take too long, the execution might be slower than expected.
To ensure consistent graph updates across devices, you can retrieve the actual interval at which the ticker executed and adjust the action accordingly.
For example, by setting every millisecond, you can create a graph that shows how many milliseconds have elapsed.
Ideally, it should increase by 1000 milliseconds per second, but if the ticker's calculations can't keep up, the elapsed time will be inaccurate.
To address this, you can use the special variable to get the elapsed time of the ticker.
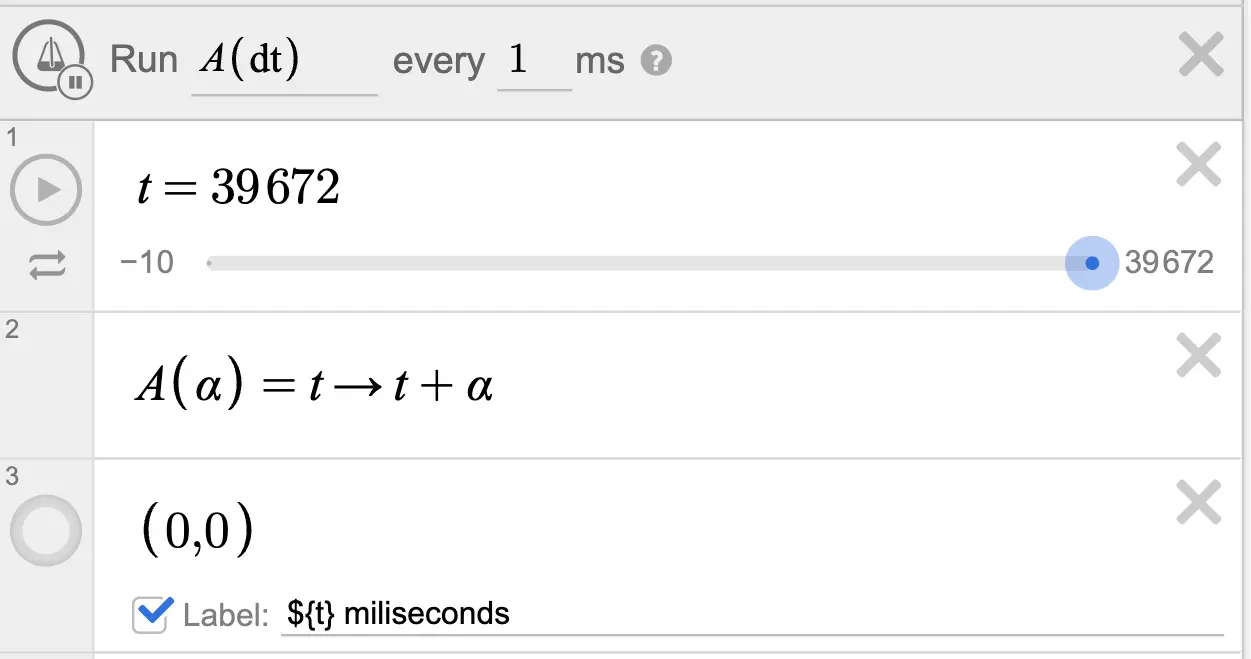
As shown in the image, represents the elapsed time of the ticker in the "Run" section. By increasing by each time, is updated correctly.
Updating Lists with Actions
For graphs drawn using lists, you can execute actions when a graph element is clicked. Often, you'll want to change the action based on which graph in the list was clicked.
In this case, you can use the special variable to identify which graph in the list was clicked.
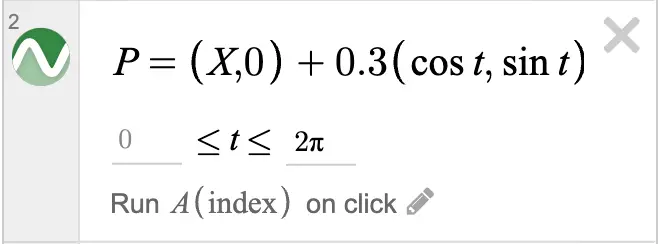
Using this, you can customize the action based on the clicked graph, as shown in the example below.
Click the green circles!